
Reading's July claimant count is 5,390, or 4.3% of working-age residents. Battle sits at 6.1% and Caversham Heights at 1.5%. All 16 wards ranked.
There were 5,390 people claiming unemployment-related benefits in Reading in July, the Office for National Statistics reported on 18 August. That is 4.3% of residents aged 16 to 64, or roughly one in 23.
The borough figure has barely moved in a year. It was 5,450 in July 2025 and 5,390 now, a fall of 60. It peaked at 5,530 in February, fell to 5,360 by June and edged up by 30 in July.
What the borough number hides is the gap between wards. In Battle, 6.1% of working-age residents were claiming. In Caversham Heights, on the other side of the Thames, the figure was 1.5%. That is a fourfold difference inside one borough.
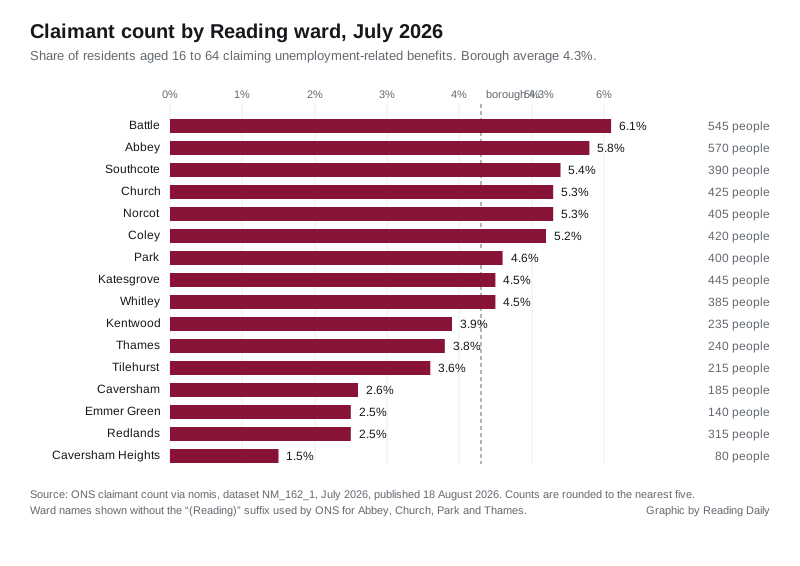
Six wards sit above the borough average, and they form a band across the centre and west of the town: Battle, Abbey, Southcote, Church, Norcot and Coley. Abbey has the largest raw number of claimants of any ward, 570, because it covers much of the town centre and has a large working-age population.
The lowest rates are all north of the Thames or east of the centre. Caversham Heights (1.5%), Emmer Green (2.5%), Redlands (2.5%) and Caversham (2.6%) are the four lowest.
How Reading compares
Reading has the second-highest claimant rate of the six Berkshire unitary authorities, behind Slough:
| Authority | Claimants | Rate |
|---|---|---|
| Slough | 6,575 | 6.0% |
| Reading | 5,390 | 4.3% |
| Bracknell Forest | 2,315 | 2.7% |
| Windsor and Maidenhead | 2,520 | 2.5% |
| West Berkshire | 2,395 | 2.4% |
| Wokingham | 2,285 | 2.0% |
Reading’s rate is more than double Wokingham’s, which begins at the borough boundary in Earley and Woodley. It is also above the South East average of 3.1% and the UK average of 3.9%, both for the same month and from the same dataset.
What the number does and does not measure
The claimant count is not the unemployment rate. It counts people receiving benefits principally because they are unemployed: those on Jobseeker’s Allowance, plus Universal Credit claimants placed in the “searching for work” conditionality group. Some of those people are working part time and still required to look for more hours. People who are unemployed but not claiming, or claiming under a different conditionality group, do not appear.
Two other cautions apply to the ward figures. Counts are rounded to the nearest five, which is why the 16 wards add up to 5,395 rather than the borough’s 5,390. And the ward series is short: nomis carries Reading ward data back to the start of 2026, not before, so a year-on-year ward comparison is not yet possible. Since January, the largest ward increases have been in Norcot (up 30) and Emmer Green and Coley (both up 20), and the largest fall has been in Caversham (down 40).
What it means for you
If you are claiming: the conditionality group you are placed in decides what you have to do to keep the payment. It also decides whether you appear in this figure. Someone working part time on Universal Credit and told to look for more hours is counted here. Someone unemployed but not claiming is not.
If you are looking at where to live: the ward gap tracks the same lines as house prices in the borough. Caversham Heights and Emmer Green are at the low end of the claimant table and the high end of the price table, and our Reading house prices page has the Land Registry figures by property type.
If you follow council spending: ward-level claimant data is one of the inputs councils use when they target employment support and area funding. ONS publishes the claimant count monthly, so the August figures follow in September.
Sources
- ONS, UK labour market bulletin, released 18 August 2026
- ONS claimant count via nomis, dataset NM_162_1, July 2026, borough, ward, regional and UK figures
Have your say