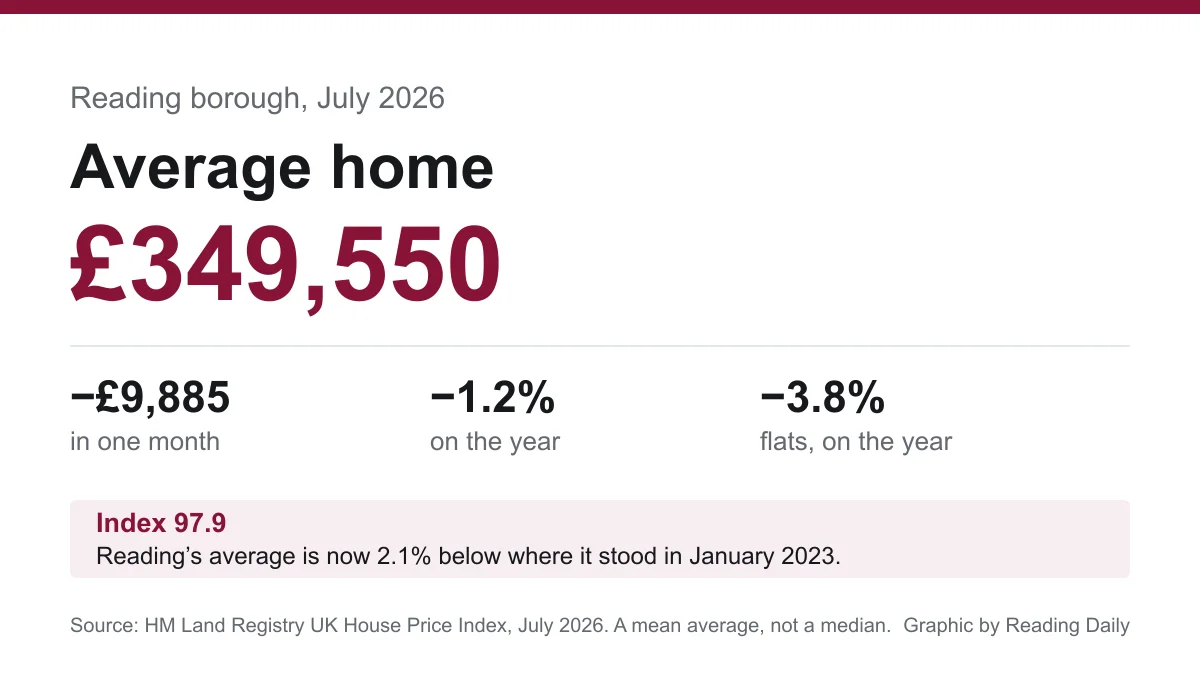

Reading's average home lost £9,885 in July and is now worth less than in January 2023. Flats fell 3.8% over the year, the weakest type in the borough.
The average Reading home was worth £349,550 in July, £9,885 less than a month earlier and 1.2% down on the year.
It is the sharpest monthly fall in the borough for some time, and it takes the average below where it stood in January 2023. The Land Registry’s index for Reading now reads 97.9, with January 2023 set at 100. In cash, the average is £7,629 lower than the £357,179 recorded then.
England as a whole went the other way in July, up 1.1% on the year. The South East was flat at 0.2%. Reading fell.
These are figures from the UK House Price Index, built from completed sales registered with HM Land Registry. One thing to hold on to throughout: the UKHPI average is a mean, not a median. A handful of expensive sales pull it up, and their absence pulls it down.
What the month actually did
| Measure | July 2026 | Change on the year |
|---|---|---|
| All homes | £349,550 | -1.2% |
| Detached | £714,852 | -1.2% |
| Semi-detached | £442,678 | 0.0% |
| Terraced | £351,976 | +0.1% |
| Flats and maisonettes | £223,165 | -3.8% |
| First-time buyer average | £307,709 | -1.2% |
The spread matters more than the headline. Semis and terraces held their value over the year, to within a tenth of a percent. Detached homes lost 1.2%. Flats lost 3.8%, and they have been the weak link in Reading for a while.
Flats are the whole story
Set January 2023 at 100 and the borough splits cleanly in two.
A Reading flat is now worth about 6% less than in January 2023. Everything else in the borough is within a couple of points of level. That is why the all-homes figure has slipped below 100: flats are a big share of the Reading market, and they are dragging the mean down on their own.
The split shows up in how people pay, too. Prices for cash buyers fell 1.9% over the year, against 1.1% for mortgaged buyers. Cash tends to buy at the cheaper end, and the cheaper end is flats.
June was revised down
When we reported the June figures in August, the Land Registry put Reading’s average at £361,243 and called it the first annual rise since January (our June report).
That number has since been revised to £359,435, £1,808 lower. This is normal and it happens most months. The index is built from sales as they are registered, and late registrations change earlier months. It is worth knowing before you treat any single month as fact: the most recent two or three months in this series are the least settled.
The revision does not change the direction. June was still up on May. July then fell hard.
How Reading compares with its neighbours
| Area | Average | Annual | On the month |
|---|---|---|---|
| Wokingham | £496,537 | -0.9% | -0.1% |
| South Oxfordshire | £476,026 | +3.0% | +0.5% |
| West Berkshire | £403,682 | +0.4% | +0.6% |
| Bracknell Forest | £395,413 | -1.4% | -0.4% |
| South East | £380,878 | +0.2% | n/a |
| Reading | £349,550 | -1.2% | -2.8% |
| England | £293,479 | +1.1% | n/a |
Reading is the cheapest of the four Berkshire and Oxfordshire districts here, and it had much the worst month. A 2.8% monthly drop against Wokingham’s 0.1% and West Berkshire’s 0.6% rise is not a regional pattern. It is a Reading number.
Bracknell Forest is the only neighbour also down on the year, at 1.4%. South Oxfordshire, just over the county line at Sonning Common and Goring, is up 3.0%.
For a Reading buyer the gap to Wokingham is now £146,987. That is the price of the borough boundary.
What the sales figures say
Sales volumes lag the price data by about two months, so July’s are not published yet. The most recent full month is May 2026, with 118 registered sales in the borough, against 121 in May 2025. Essentially flat.
Treat any comparison with spring 2025 with care. March 2025 recorded 335 sales in Reading, nearly three times a normal month, because buyers were completing ahead of the stamp duty threshold change. That spike distorts every year-on-year sales comparison through the first half of 2026, and it is not a sign of a collapsed market now.
Across January to May 2026 the borough registered 605 sales.
What it means for you
If you are selling a flat, the market has moved against you and it has been moving for three years. A Reading flat is worth about 6% less than in January 2023 while houses have held level. Price to the market you are in, not to the borough average.
If you are buying, a 2.8% monthly fall is one month, not a trend, and it may be revised. But the twelve-month picture is consistent: Reading has gone nowhere in cash terms since early 2023 while the rest of England has edged up.
If you are watching your own street, the borough average is close to useless for that. The Land Registry publishes actual sold prices by postcode in its price paid data, and that is the number to look at.
If you are budgeting for next year, our guide to Reading council tax bands sets out what each band costs, and the band is set on 1991 values rather than anything in this report.
We publish this series every month the Land Registry releases it. The running picture is on our Reading house prices page.
Sources
- HM Land Registry UK House Price Index, Reading, July 2026 for the borough average, the split by property type, the first-time buyer average, the index values and the cash and mortgage figures.
- UK House Price Index, Wokingham, West Berkshire, Bracknell Forest and South Oxfordshire for the neighbour comparisons.
- UK House Price Index, England and the South East region for the national and regional context.
- HM Land Registry price paid data for individual sold prices.
The UK House Price Index is a mean average, not a median. Sales volumes are published about two months in arrears and recent months are revised as late registrations come in.
Have your say